RTDose module#
This module contains functions for working with RT Dose and RT Structures in DICOM files.
Dose volume histogram#
import Dosepy.rtdose as rt

# Load the DICOM files (do not forget to change this to your file path :)
dose_map = rt.load_dose("/media/luis/TOMO/Dosepy/Hombro20en1/RD_3D_arc1y2.dcm")

structure_set = rt.load_structures("/media/luis/TOMO/Dosepy/Hombro20en1/RS/RS.dcm")

# Get the physical coordinates of the structure "PTV_High"
ptv_coordinates = structure_set.get_coordinates("PTV_High")

# Get dose values in the structure
dose_in_ptv = rt.get_dose_in_structure(
    dose_distribution = dose_map,
    coordinates = ptv_coordinates,
)

# Show the Dose Volume Histogram (DVH)
rt.plot_dvh(dose_in_ptv)
To get Dx: minimum dose received by the hottest sub volume x (e.g., D20%[Gy])
import numpy as np

# Volume as percentage
volume = 20

# Minimum dose to the hottest 20% of the volume
D20 = np.percentile(dose_in_ptv, 100 - volume)

# Compare with TPS (Eclipse v16)
reference = 3.55  # Dose reported by the TPS
difference = 100 * (D20 - reference) / reference  # Percentage

print("PTV_High")
print(f"D20% (Dosepy) = {D20:.2f} Gy")
print(f"D20% (Reference TPS) = {reference:.2f} Gy")
print(f"Difference = {difference:.2f} %")
PTV_High
D20% (Dosepy) = 3.46 Gy
D20% (Reference TPS) = 3.55 Gy
Difference = -2.54 %
The 2.54% difference may be attributed to variation in the interpolation method used by the TPS and Dosepy to associate a dose to a point in the structure. To observe this effect, let’s analyze a structure with a larger volume, such as the “BODY” structure where the physical resolution and interpolation becomes less influential.
# Print structures

structure_set.get_names()
{'BODY': 1, 'PTV_High': 2, 'CouchSurface': 3, 'CouchInterior': 4}
# Create the DVH for BODY
body_coordinates = structure_set.get_coordinates("BODY")

dose_in_body = rt.get_dose_in_structure(
    dose_distribution=dose_map,
    coordinates=body_coordinates,
)

# Show the Dose Volume Histogram (DVH) for BODY
rt.plot_dvh(dose_in_body)
# Dose to the hotest 20% of the volume
D20p = np.percentile(dose_in_body, 100 - volume)

# Compare with TPS (Eclipse v16)
reference = 1.13
difference = 100 * (D20p - reference) / reference

print("BODY")
print(f"D20% (Dosepy) = {D20p:.2f} Gy")
print(f"D20% (Reference TPS) = {reference:.2f} Gy")
print(f"Difference = {difference:.2f} %")
BODY
D20% (Dosepy) = 1.13 Gy
D20% (Reference TPS) = 1.13 Gy
Difference = 0.24 %
Numpy mask#
It is useful to generate boolean masks for visualization or to extract values inside a region of interest. The next example uses the dose distribution as a reference for the physical resolution and size of the mask, but a CT image can be used as well.
from Dosepy.rtdose import get_2D_mask_by_coordinates_and_image_shape
import plotly.express as plt

ptv_mask = get_2D_mask_by_coordinates_and_image_shape(
    coordinates = ptv_coordinates[0],  # The first slice (an the only one in this example)
    image = dose_map
)

plt.imshow(ptv_mask)
Dose object#
The RTDose module leverages the SimpleITK library, utilizing the Image class to represent dose distributions. This allows users to access the full suite of methods and functionalities provided by SimpleITK for image processing and analysis. For example, you can easily manipulate, resample, or visualize dose distributions using familiar SimpleITK operations.
# Basic image attributes

print(f"DICOM origin: {dose_map.GetOrigin()}")
print(f"Size: {dose_map.GetSize()}")
print(f"Spacing: {dose_map.GetSpacing()}")
print(f"Direction: {dose_map.GetDirection()}\n")
DICOM origin: (-92.9, -328.3, -59.0)
Size: (102, 90, 60)
Spacing: (2.0, 2.0, 2.0)
Direction: (1.0, 0.0, 0.0, 0.0, 1.0, 0.0, 0.0, 0.0, 1.0)
For more information on the SimpleITK Image class, refer to the SimpleITK documentation.
Conversion to numpy array and plotting:
import SimpleITK as sitk

plt.imshow(sitk.GetArrayFromImage(dose_map[:, :, 30]))
DICOM Reference Coordinate System#
The DICOM standard defines a Reference Coordinate System (RCS) which is oriented with respect to the patient. The RCS allows us to measure the position and orientation of an image relative to the patient.
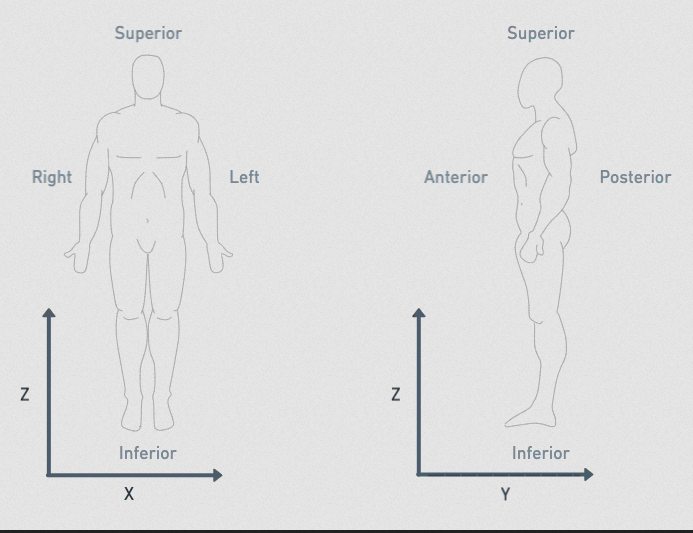
The positive X direction points to the patient’s left.
The positive Y direction points towards the patient’s back (anterior to posterior).
The positive Z direction points towards the patient’s head (inferior to superior).
EQD2 conversion#
import Dosepy.rtdose as rt

# Load the DICOM files
dose_map = rt.load_dose("/media/luis/TOMO/Dosepy/Hombro20en1/RD_3D_arc1y2.dcm")
structure_set = rt.load_structures("/media/luis/TOMO/Dosepy/Hombro20en1/RS/RS.dcm")

rt.eqd2(
    dose_distribution = dose_map,
    fractions = 1,
    structures = structure_set,
    alpha_beta = {
        "PTV_High": 10,
    }
)